scenario · draft
The Grand Kankakee Marsh, its water and its birds
A vast Indiana marsh full of ducks, geese, cranes and herons was drained for farms by 1918, and its nesting birds thinned out or left. What would putting water back do for birds and floods?
WaterFood & landLiving systemsCities & placesPeople & society
The Grand Kankakee Marsh filled much of the Kankakee River valley in northwest Indiana, and in the nineteenth century its wildfowl shooting was famous across the country.2,3,21 Alfred Meyer, writing in 1936, called its wild-rice sloughs "scenes of countless wild geese and ducks".25 A Forest and Stream correspondent recalled in 1903 that, some fourteen years before, prosperous club houses stood at points on the marsh and few places in the country offered more to the wildfowl shooter.24 From the 1880s to 1918 ditches and dredges drained it for farming.2,3 People who watched it happen recorded marsh birds growing scarce, nesting species driven away and the shooting falling off, and they blamed both the ditches and the guns.19,21,22,23 Sandhill cranes were locally abundant breeders in northwest Indiana until 1929.26 Now tens of thousands stop each autumn at Jasper-Pulaski Fish and Wildlife Area, roosting in its shallow marshes and feeding in farm fields.27 The question here is how the marsh's water and its birds depend on each other, and what returning some of the water would do for the birds as well as for the floods below.4
The Kankakee River rises near South Bend, Indiana, and flows west into Illinois to join the Des Plaines and form the Illinois River. Its basin covers 2,989 square miles in Indiana and 2,169 in Illinois.1 Most of the valley upstream of Momence, Illinois, was once the Grand Kankakee Marsh, a mosaic of grassy wetlands, hardwood swamps and sandy islands.2,3 Estimates of its size differ. The USGS gives about 400,000 acres, in a corridor 3 to 5 miles wide on each side of the river.3 The Indiana Department of Natural Resources gives 625 square miles, a 1992 Illinois State Water Survey report 500,000 acres, and the Natural Resources Conservation Service close to a million acres.1,2,12 The river wound through it for some 240 to 250 miles.2,4 Wikipedia reports nineteenth-century counts of about 2,000 bends between South Bend and Momence.16 Water stood 1 to 4 feet deep over the marsh for eight or nine months of the year.2 Just upstream of Momence a limestone ledge in the riverbed constricted the flow.2 In Newton County lay Beaver Lake, then the largest lake in Indiana: 7 miles long, 5 wide and no more than 10 feet deep.11
The ancestors of the Pokagon Band of Potawatomi, whose villages were in and around the South Bend area, used the marsh for fishing, gathering and hunting, a tribal representative told the Department of Agriculture.12 The Treaty of Tippecanoe of 1832 sold the lands of Menominee's Potawatomi community without his consent.15 In August 1838 some 800 Potawatomi were collected at Twin Lakes in Marshall County, Indiana. On 4 September the militia removed 859 at gunpoint and marched them more than 600 miles to Kansas. Forty-two died on the way.14,15
The birds of the marsh
The record of the marsh's birds is what naturalists and hunters wrote down.19,20,22 In 1888 Maurice Thompson published a list of the water and shore birds of the Kankakee region in the state geologist's report, from his own field notes and what others reported to him.20 He found red-winged blackbirds swarming in every grassy marsh, mallards in large flocks in spring and autumn, Canada geese settling in large flocks for a week or ten days, and wood ducks very plentiful on the river and its tributaries.20 Field plover, common on the wet meadows in spring and autumn, were "much sought after for the market by pot-hunters".20 Great blue herons were found everywhere along the river and were especially numerous on the marshes around English Lake.20
Amos Butler's catalogue of Indiana's birds, published in the state's report for 1897, gathers dated notes from observers on the marsh.19 Ruthven Deane saw about seventy-five wood ducks in a day at English Lake on 29 July 1889. In 1890 he found blue-winged teal nesting there.19 Herons nested in colonies in the timber along the river. At one known as "Crane Heaven", visited by C. E. Aiken in May 1886, great blue herons, black-crowned night herons and egrets "hovered in hundreds above the tree tops" of a timbered belt standing in twelve to eighteen inches of water.19 Timothy Ball of Crown Point remembered sandhill cranes in abundance some fifty or sixty years earlier, nesting in the marsh and coming into the cornfields in the fall in flocks of forty to a hundred.19 He thought whooping cranes, fewer than the sandhills, nested there too, and that swans had once bred in the Kankakee marshes of Lake County.19 Passenger pigeons, W. W. Pfrimmer reported, had nested in great numbers in the timber along the river in Newton County.19
Clubs such as the Maksawba kept houses on the marsh, and in March 1898 Forest and Stream reported on the duck flight at Water Valley and the Maksawba Club.22,24 Earl Reed, who wrote about the river in 1920, described "millions upon millions of water fowl" in its flooded lowlands and wild rice.21 It is a writer's figure.
How it was drained
Ditching of some of the tributaries began in the 1880s to make the land farmable. When that did not drain it, the dredging moved downstream.2 In 1893 Indiana cut the ledge at Momence down by several feet; apart from that, the river in Illinois was left as it was.2 The main channel in Indiana was straightened by a series of projects. The Illinois State Water Survey says they were finished in 1917; the USGS dates the work on the main stem from 1906 to 1918.2,3,4 The dredges cut from one meander to the next and joined the straight pieces. The river kept its course down the valley but lost its bends, and its connection to the floodplain was reduced.4 In Indiana it went from about 250 miles to 82, and its slope from 0.45 to 0.83 feet per mile.4 The tributaries became a network of ditches; by the state's 1990 count, less than 1% of the watershed's streams were in natural condition.2 Spoil from the dredging was cast beside the channel. It now forms berms that are discontinuous and unstable in many places, and the 2019 work plan for the river concluded it was placed for convenience, not for flood protection.4 Indiana as a whole lost an estimated 87% of its wetlands between the 1780s and the 1980s, from 5.6 million acres to about 750,000. Illinois lost 85%.9
Where the birds went
The losses Butler's observers describe came before the main channel was dredged, while the tributaries were being ditched.2,3,19 Butler, writing of Indiana as a whole in 1897, said that settlement had steadily reduced many birds, geese, ducks and other water birds above all, and that as sloughs and swamps were drained the birds that lived among their reeds and flags disappeared.19 One observer tied a loss to this marsh directly. L. T. Meyer said the whooping crane had been a summer resident of Lake County but that "the draining of the Kankakee marshes has driven it away".19 Ball said a few sandhill cranes still nested in Lake County in 1897.19 Of Lake County, J. G. Parker said mallards were shot by the thousand each year about its lakes, and that their numbers were falling fast "as swamps are drained, marshes reclaimed, and lakes reduced in size".19 Blue-winged teal still bred on the river, but Butler wrote that "the numbers are growing less and less each year".19
The same sources also point to the guns and to fire. Aiken called the wood duck formerly one of the most abundant summer residents and saw only two or three pairs on trips to Water Valley in 1886 to 1888; Butler added that the river had afforded excellent wood duck shooting until late years.19 The two accounts of wood ducks from those years, Aiken's and Thompson's, disagree.19,20 Of Indiana's heronries Butler wrote that swamps had been drained, trees felled, fire had ravaged the colonies and the birds had been shot or driven away. F. M. Woodruff found no egrets at the Kouts heronries in June 1896 and put it down to a fire that swept the timber along the river in the fall of 1895.19 In March 1898 Forest and Stream reported that on the Illinois River the number of hunters had driven the ducks away, and that on the Kankakee the same had been true in miniature.22 Reed blamed the breech-loader and the market hunters who sold "great quantities of ducks", and then the dredges: "The wild life fled. Wondering flocks in the skies looked down on the strange scene, changed their courses and winged on."21
By 1899 some Chicago shooters blamed the ditches. Abe Kleinman, an old-time game shooter, told Forest and Stream that "if you dry up all the marshes you can't expect to have ducks or snipe", and that the whole Kankakee marsh would soon be "dry as a bone".23 In 1903 Forest and Stream reported a ten-mile ditch across the Maksawba Club's grounds, leaving the old river as a string of stagnant pools, and corn being ploughed where the writer had shot jacksnipe and built blinds for mallards.24
The sources support the idea that much of the marsh's bird life had to move on, most clearly for the birds that nested there: whooping and sandhill cranes, swans, herons, teal and wood ducks.19 They do not measure it, and they do not separate drainage from shooting or fire.19,21 Migrants were a different case. Sandhill cranes, locally abundant breeders in northwest Indiana until 1929, now stop there each autumn in numbers that have grown since counts began in 1967, roosting in managed marsh and feeding on drained farmland.26,27
What followed
Citing state figures from 1976, the Illinois State Water Survey reported that floods still spilled over about 222,000 acres, some 40% of the old marsh, about three times a year.2 Of the cropland in the Indiana part of the watershed, 64% then had excess water problems.2 Severe flooding and sediment led to legal battles between Indiana and Illinois in the 1980s.4 Annual peak flows have trended upward at every gage in the system except Kouts, whose record is short.4 At Momence the trend line runs from about 5,200 cubic feet a second in 1915 to 9,200 in 2018, a rise of 77%. At Shelby, Indiana, the rise since 1923 is 39%.4 The work plan puts this down to heavier rain with climate change, faster runoff from development and farm drainage, and lost floodplain storage.4 The flood of February and March 2018 set the highest stages on record in several places.4
The central and lower river corridor is mostly wind-blown sand, and so are the spoil piles. As high flows grow more frequent the piles erode, and the sand moves down the river into Illinois.4 The Yellow River is the largest tributary in Indiana, and in big flows it brings a disproportionate share of the sand.4 Below Momence, near Aroma Park, islands formed in the river; a 1981 study put most of their growth down to sand deposited during and after the channelization.4 At Shelby the USGS estimated that the river carried 105,000 tons of suspended sediment, 8,690 tons of nitrogen and 265 tons of phosphorus in 2016. In 2017 the figures were 91,000, 8,890 and 236 tons.6 What drainage did to the river's flow cannot be measured directly, because most of it was finished before streamflow records began.2,3 From the storage the marsh provided, the Illinois State Water Survey inferred in 1992 that floods are probably higher and drought flows lower than before. Its model takes the drained river of the 1920s as the natural baseline.2
One stretch still shows the old river. In the Momence Wetlands upstream of Momence the Kankakee meanders with a sinuosity of 1.46. The work plan compares it with the cut-off meander scars in Indiana and treats this reach as representative of the river before straightening.4 It calls the reach a shock absorber that stores water and sediment for the river below.4
Water and birds
Before drainage, water stood 1 to 4 feet deep over the marsh for eight or nine months of the year.2 The waterfowl strategy of the Upper Mississippi River and Great Lakes Region Joint Venture sets out what depth and season mean for ducks across a region that takes in all or part of Indiana and Illinois.31 Mallards, teals, pintails and shovelers use shallow water, 5 to 50 cm deep, in herbaceous wetlands of a hectare or more when they are not breeding.31 Their best habitat has water that rises and falls: seed-bearing plants grow on wetland bottoms that dry out, and the birds choose those sites once they flood again.31 In this region their autumn migration peaks between September and December, blue-winged teal first and mallards last, and blue-winged teal are the last to return in spring.31 To breed, blue-winged teal want shallow open water under a metre deep, with emergent marsh, set in grassland; wood ducks want mature trees beside shallow wetlands.31 The strategy names row-crop farming and urban growth as the two worst pressures on wetland bird habitat in the region.31 In the most altered areas, crops, invasive plants, forest or development have replaced the wet meadows and shallow edges that are often the most valuable parts.31
The old accounts describe the same ties on this river. Thompson found teal breeding in grassy wet tussocks, snipe on wet meadows and prairie bogs, and coots in the thickest grass standing in "a slush of water and bog-mud".20 Wood ducks nested in the bur oak bottoms along the river.19 Hooded mergansers, which bred on the river, lingered in autumn as long as the water stayed open, Butler wrote, and the first freeze-up started them south.19 Water could also come at the wrong time. Deane wrote in June 1892 that the Kankakee region had been practically under water for two months that spring. He thought most of the quail nests had been destroyed.19
At Jasper-Pulaski the cranes use both kinds of land. They gather each night in wetlands near the middle of the property, rise at sunrise to feed in the farm fields around it, and return to roost at dusk.27 The roosting marshes are closed to the public.27
The birds now
Jasper-Pulaski Fish and Wildlife Area holds 8,179 acres of wetland, upland and woodland; the state began buying the land in 1929.28 Wikipedia says it was set up to make up for habitat lost when the marsh was drained.35 Systematic weekly autumn counts of its cranes began in 1967.26 Peak counts rose from 2,500 in 1967 to 27,600 in 1997, with 32,600 in 1991.26 A review presented in 2000 found that the peak had moved about two weeks later, to mid-November.26 The state now gives the peak as late November or early December.27 The highest weekly counts in recent years were 31,975 on 22 November 2022, 32,938 on 28 November 2023, 20,535 on 3 December 2024 and 16,400 on 2 December 2025.27 Endangered whooping cranes sometimes travel with them.27 Sandhill cranes nest in Indiana again, first documented in 1982 in the far northeast; about 30 pairs nested in the state's two northern tiers of counties around 2000, most of them in the northeast.26
On the river itself, the Kankakee Fish and Wildlife Area where the Yellow River meets the Kankakee has 4,199 acres of open water, marsh, riparian timber, periodically flooded crop fields and 11 miles of river.5,29 The state bought 2,302 acres of the remaining marsh there in 1923 and took up waterfowl management in the 1950s.29 Some years after the flood of 1959 it built cross levees in the marsh to manage the water.30 The area is known for waterfowl hunting and is also visited by birders.29 At Kankakee Sands, on land that was once part of the marsh and Beaver Lake, The Nature Conservancy's restored land provides habitat for more than 240 bird species, including Henslow's sparrow, northern harrier and least bittern. Its bison keep the grass short enough for upland sandpipers.11
Who needs an answer
- The Kankakee River Basin and Yellow River Basin Development Commission. The Indiana General Assembly created it in 2019, and it brings together eight Indiana counties, the Department of Natural Resources and advisers from Illinois.5,18 It holds a 75-foot easement from the top of each bank and may buy land from willing sellers for flood storage and levees.5 Its capital projects are paid for by assessments, such as $1 a farm acre and $7 a residential parcel.5 In September 2019 it adopted a 40-year plan.5 The plan's cost is put at a minimum of $134 million, needing up to $5.8 million a year against about $3 million expected from the assessments.4
- Farmers and drainage districts. About 1.1 million of the 1.3 million acres in the commission's counties are farmed.5 The work plan counts about 1.5 times as many miles of drainage per square mile in the Kankakee system as in other northern Indiana rivers.4 It proposes buying flood-prone land and leasing it back, or buying flood easements, so that farmers can keep farming land that is allowed to flood.4
- Towns in Illinois. Momence and Kankakee on the river, and Watseka on the Iroquois, have homes and roads in the floodplain.4
- The holders of restored land. Indiana turned the area where the Yellow River meets the Kankakee back to marsh in 1933.5 The Kankakee Fish and Wildlife Area there has internal berms the work plan would breach so the two rivers can share their floodwater.4 The Nature Conservancy bought 7,200 acres of farmland in Newton County in 1996, on land once part of the marsh and Beaver Lake. It now manages the 8,400-acre Efroymson Prairie at Kankakee Sands.11 Since 2002 the Pokagon Band has restored 1,147 acres of the marsh to wetland with the Natural Resources Conservation Service.12 The U.S. Fish and Wildlife Service's Kankakee National Wildlife Refuge and Conservation Area, established in 2016, is 66 acres of oak savanna.13 In 1998 the Service was proposing a 30,000-acre refuge in the basin.3
The domains it chains
Rain falls on sandy outwash that feeds the river through the ground: base flow is more than 80% of the Kankakee's runoff.1 The denser the ditches and tile, the faster runoff reaches the river.4 The straight channel carries floods and sand to the Illinois line, where the river still winds through wetland.4 How much of the river's nitrate arrives through the groundwater is a question the USGS has set out to answer at Davis, with four wells beside the gage.7 Where the marsh held water, the floodplain is now farmed and built on.4 The same water decided which birds could live there: how deep it stood, for how long, and in which weeks.2,31 Drained fields now feed migrating cranes by day while managed marshes hold them at night.27
What a twin should let people try
- Put the marsh back: lay the land cover recorded by the 1830s surveys over today's terrain, run the floods of record through it, and compare the peaks at Shelby and Momence with what the gages measured. That would test the 1992 inference about floods and low flows before drainage.2
- Restore a share: return a tenth, a quarter or half of the old marsh to wetland, choosing the parcels, and see what changes downstream in flood peaks, sand reaching Illinois and nitrogen passing Shelby.
- Move the levees back. In the work plan's own hydraulic model, removing every berm along the main stem cut flows by about 15% and lowered flood levels in some areas by 1.5 feet.4 Its smaller set of breaches and setback berms gave 9% and 0.9 feet.4 The first run left the berms on tributaries and field ditches in place.4 A twin should reproduce those runs, then open the tributaries too. The idea is old here: in 1990 the state reported a proposal for setback levees along 60 miles of the river, whose future was then uncertain.1
- Drainage: how high the water table would rise under nearby fields if an outlet ditch were left to fill in or a berm were breached, and how many acres could still be cropped.
- Put the birds back on the map: for each week of the spring and autumn migrations, work out how many acres would stand under 5 to 50 cm of water, first for the 1830s marsh, then for today's valley, then for each restoration option.10,31 Set those acres against eBird's weekly estimates of the ducks and cranes using the valley.32 eBird models one recent year on 3 km cells, fine enough to follow a corridor a few miles wide.3,32 Nothing here has been run; it is a frame for testing whether the birds follow the water.
- Nesting: in the restored areas, how long water would stand from April into June, where teal would find shallow water in grass, and how often a spring flood like that of 1892 would drown the nests.19,31
- Cranes and corn: whether restored marsh near Jasper-Pulaski or along the river would spread the cranes' roosts, and what that would mean for the fields they feed in.27
- Future rain: the work plan cites a Notre Dame study finding that today's 1% annual chance flood will likely come twice as often.4 Run each option under that.
Where to start
A team led by Samniqueka Halsey digitized the Public Land Survey notes for the marsh, made about the 1830s, in a dataset published by the University of Notre Dame on ScienceBase.10 The data holds a pre-settlement land cover layer for the basin's counties in Indiana and Illinois and a layer of streams, drains, rapids and springs.10 It also marks trails, homesteads, mills, roads, Indian settlements and mounds that the surveyors noted.10 The USGS gage at Momence has daily discharge from 1905 and annual peaks from 1915; Shelby's daily record starts in 1923 and Davis's in 1925.8 Davis and Shelby measure nitrate continuously.6,7 All are in USGS Water Data. The Shelby regression models estimate daily sediment, nitrogen and phosphorus loads from the continuous sensors.6 For the 2019 work plan the engineers built a new two-dimensional hydraulic model of the river.4 Today's wetlands are in the National Wetlands Inventory, and FEMA's flood zones in the National Flood Hazard Layer. The general question is under flooding.
For the birds, the historical baseline is Butler's 1897 catalogue and Thompson's 1888 list, with their dated observations at English Lake, Water Valley and Kouts.19,20 Today's distribution and weekly abundance are in eBird, whose Status and Trends models estimate relative abundance for every week of the year.32 The state's weekly crane counts at Jasper-Pulaski run each autumn.27 The Christmas Bird Count, begun on Christmas Day 1900 and now held each year between 14 December and 5 January, has recorded wintering cranes in Indiana every year since 1983.26,33 The North American Breeding Bird Survey has counted birds along roadside routes, mainly in June, since 1966.34
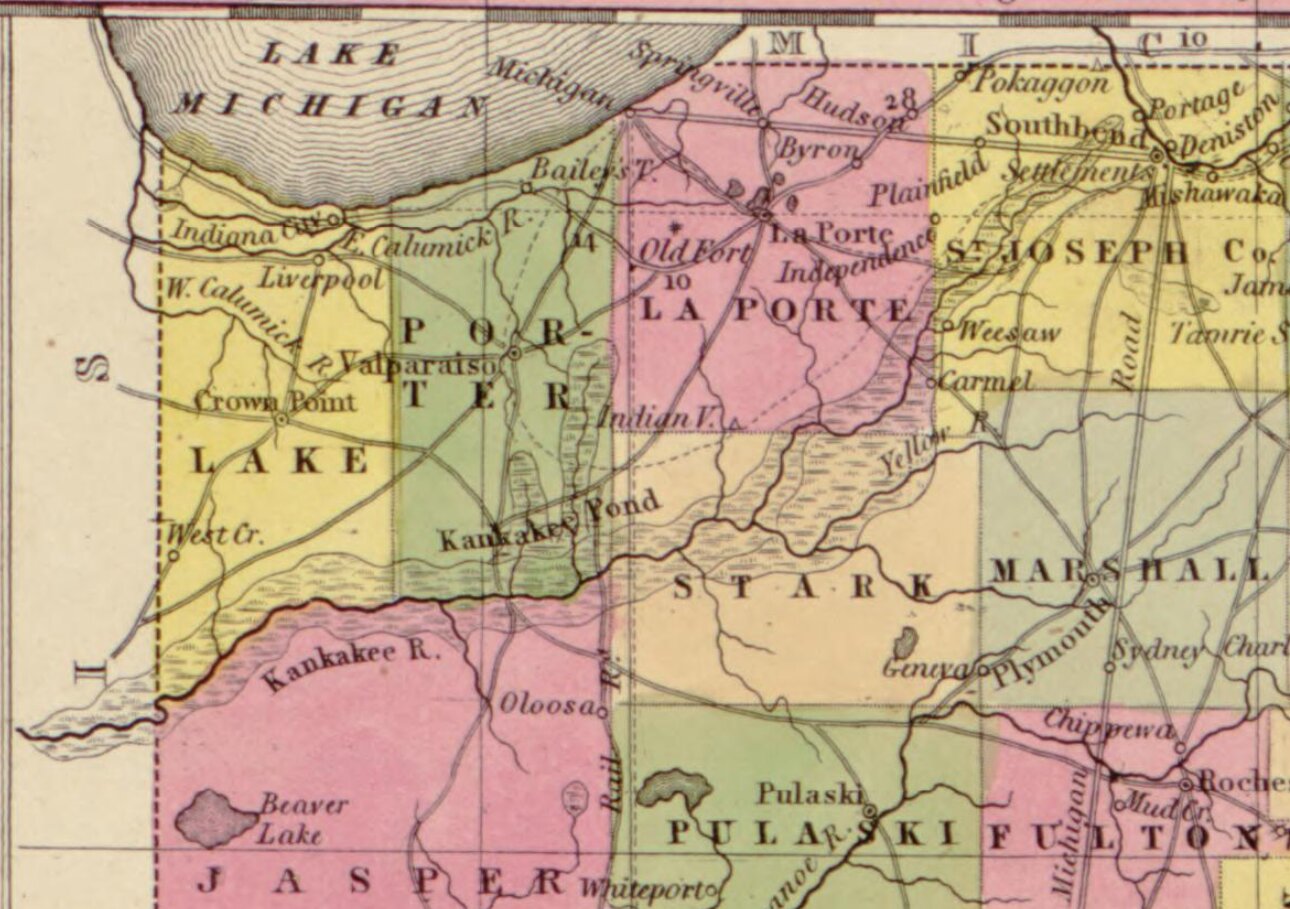
The picture is a detail of Samuel Augustus Mitchell's 1849 map of Indiana, from the Library of Congress and in the public domain. The marsh is drawn along the Kankakee and Yellow rivers, with Beaver Lake to the south.17
- place
- The Kankakee River basin in northwest Indiana and northeast Illinois, from South Bend to Momence and the river below
- since
- 1886
- scale
- bioregion
is an instance of this concept or technique
-
Which areas will flood, how often, and what would changing a river, drain or pump do to the flooding?
-
If land changes use, farm to housing, forest to pasture, floodplain to park, what happens to water, habitat, carbon and food?
requires this data or input
-
US Fish and Wildlife Service maps of the nation's wetlands and deepwater habitats by type and extent, viewable in the Wetlands Mapper and downloadable by state or watershed
open dataAPIclosed participation
-
FEMA's national GIS layer of official flood zones, including the high-risk areas under floodplain rules and the flood insurance purchase requirement
open dataAPIclosed participation
-
Cornell Lab of Ornithology project in which birders submit complete checklists; the records, and weekly abundance maps modelled from them, are free for research and education.
partly open dataAPIopen participation
Tags: birds, waterfowl, sandhill cranes, bird migration, Kankakee River, wetland drainage, channelization, flooding, sediment, nitrogen, wetland restoration, historical reconstruction