Food & land
Cultivated landscape is the symbol; pastel lime is the colour.
tools
-
Simulates crop growth under specified weather, soil and management conditions.
-
Finds environmental features in satellite imagery through examples, search and review.
-
Connects energy, water, land, economy and climate in regional and global scenarios.
-
Maps and values ecosystem services in terrestrial, freshwater, coastal and urban settings.
-
Part of Google Earth AI; given a user's local outcome data such as disease rates or crop yields, it picks relevant population and satellite signals and trains models for spatial prediction, downscaling and forecasting.
questions
-
How might land-use changes affect water, habitat, carbon or agricultural production?
organizations
-
Argentine network of rural organizations, technicians and researchers, grown out of Cooperativa Ayllu, CEFIC and reGOSH in Mendoza, that builds open-hardware instruments and a soil-data web app so farmers can track soil health through agroecological transitions.
books
-
The 1972 Club of Rome report by Meadows, Meadows, Randers and Behrens that used the World3 system-dynamics model to ask whether exponential growth in population and industry could continue on a finite planet.
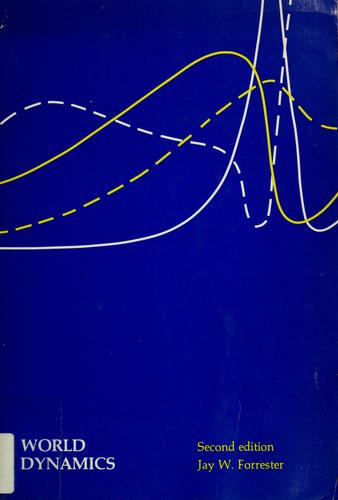
Jay Forrester's 1971 system-dynamics model of the world as one system of population, capital, food, resources and pollution; the model behind The Limits to Growth.
Symbol: "farm crops" by Made, Noun Project, CC BY 3.0.