Presentation
Globes, maps and viewers that let a person see what a model did.
Libraries and applications that draw a model's output as a globe, a map, a scene or a chart, in a browser or on a desktop. Several run entirely in a browser with no account.
3D cities and mapping
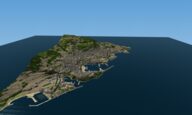
Hosted web tool that builds a low-poly 3D model of any place on Earth from a box drawn on a map, with terrain, buildings, roads, coastline and trees from open geographic data.
Cities & places closed sourceopen data

Open-source JavaScript library from Cesium for 3D globes and maps in the browser; streams 3D Tiles, terrain, imagery and time-dynamic data on a WGS84 globe.
Cities & places open sourceAPIopen participation
-
GPU-powered framework for visual exploration of large datasets in the browser, built by composing layers; draws over base maps from MapLibre, Mapbox, Google Maps and ArcGIS.
Cities & places open sourceAPIopen participation
-
Python package from the GitHub account milos-agathon that renders 3D terrain and thematic maps from elevation, raster and vector data, with a Rust and WebGPU renderer underneath; makes still images, vector files and frame sequences without a GUI.
Cities & places open sourceAPIopen participation
-
Free, open-source GIS from the opengeos project that loads, styles and analyses geospatial data in a web browser, as a desktop or phone app, or inside a Jupyter notebook, keeping the data on the user's own machine.
Cities & places open sourceAPIopen participation
-
Open-source browser globe by Bilawal Sidhu and Sameh Khamis that puts live public feeds on Google's photorealistic 3D tiles: aircraft, ships, satellites, earthquakes, fires, weather, public cameras.
Cities & places open sourcepartly open dataopen participation
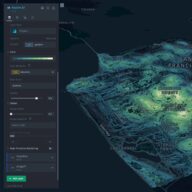
Open-source geospatial analysis tool for large datasets that runs in a browser: load a file, add layers, filter and animate over time, without writing code.
Cities & places open sourceopen participation

Open-source map libraries from the MapLibre organization: GL JS for GPU-accelerated vector-tile maps in a web page, Native for mobile, desktop and embedded apps, plus a style specification, a tile format and the Martin tile server.
Cities & places open sourceAPIopen participation
-
VU.CITY Limited supplies 3D city models and planning tools for the built environment in UK and Irish cities and New York; BuildWind SRL simulates wind, air quality and temperature street by street from a 3D city model, live in Brussels.
Cities & places closed sourcepartly open dataAPI
Research infrastructure
-
Open-source data analysis and visualization application from Kitware for the output of simulations and other large datasets.
Cities & places open source
Thematic maps and globes
Prototype web app from Esri's Applications Prototype Lab that links a 3D map of species observations in the San Bernardino National Forest with a 3D food-web graph to show the knock-on effects of losing a species.

Mycosoft's hosted 3D globe inside its NatureOS platform; it shows environmental layers, the positions of the company's field sensors, historical playback and forecast context, drawing on its MINDEX database of species and observation records.
Free interactive web map of world trade that shows bilateral trade flows, tariff rates and tariff history, and ships a day through ten maritime chokepoints, each value shown with its source and reporting date.
Movement & logisticsEnergy closed sourceopen data