data source · draft
CADI, Climate-Driven Agricultural Decline Index
Global 10 km map of observed and projected change in attainable crop yields under climate change, from a team at IAE-CSIC and the Barcelona School of Economics, measured in people fed per grid cell.
What is reusable: unknown sourceunknown dataAPI unknownunknown participation The site offers interactive maps only; no download, licence or API is stated.
The index was built by Laura Mayoral, Hannes Mueller, Björn Komander and János Szentistványi, from the Institute for Economic Analysis (IAE-CSIC), the Barcelona School of Economics, IIIA-CSIC, RMIT University Melbourne and IDEA.3
For each grid cell of about 10 km, the project uses the Global Agro-Ecological Zones model (GAEZ v5) to compute attainable yield: the most a location could produce under its biophysical conditions.1,2 The crop mix in each cell is held at the baseline, so only climate varies and no adaptation is assumed.1 Attainable production of the main crops is converted to calories and reported as the number of people a cell could feed each year at 2,000 calories a day.1
Observed change compares the 1981–2000 climate with 2001–2020, using the AgERA5 weather dataset.1 Projections run from 2021 to 2100 against the 2001–2020 baseline, using two IPCC scenarios, SSP3-7.0 and SSP5-8.5 (standard pathways of future emissions and development).1,2
Results are shown in an interactive map explorer that has a slider over time periods and switches between observed and projected change, and between absolute and percentage values.2 The site, aimed at policymakers, development practitioners and researchers planning adaptation, offers no download, licence or API for the underlying grid.1,2
The team reports that more than 640 million people live in farming areas where the number of people that can be fed has fallen by more than 10% over 30 years.1,4 By 2041–2060 under SSP3-7.0, about 49% of the world's population would live in cells with at least a 5% decline.1,4 A full paper is forthcoming.4
- coverage
- global
- resolution
- grid cells of roughly 10 by 10 km
- cadence
- 20-year periods; 1981–2000 and 2001–2020 observed, 2021–2100 projected
- access
- web map explorer; a data download is not stated on the site
- homepage
- https://cadi.econai.org/
cited by
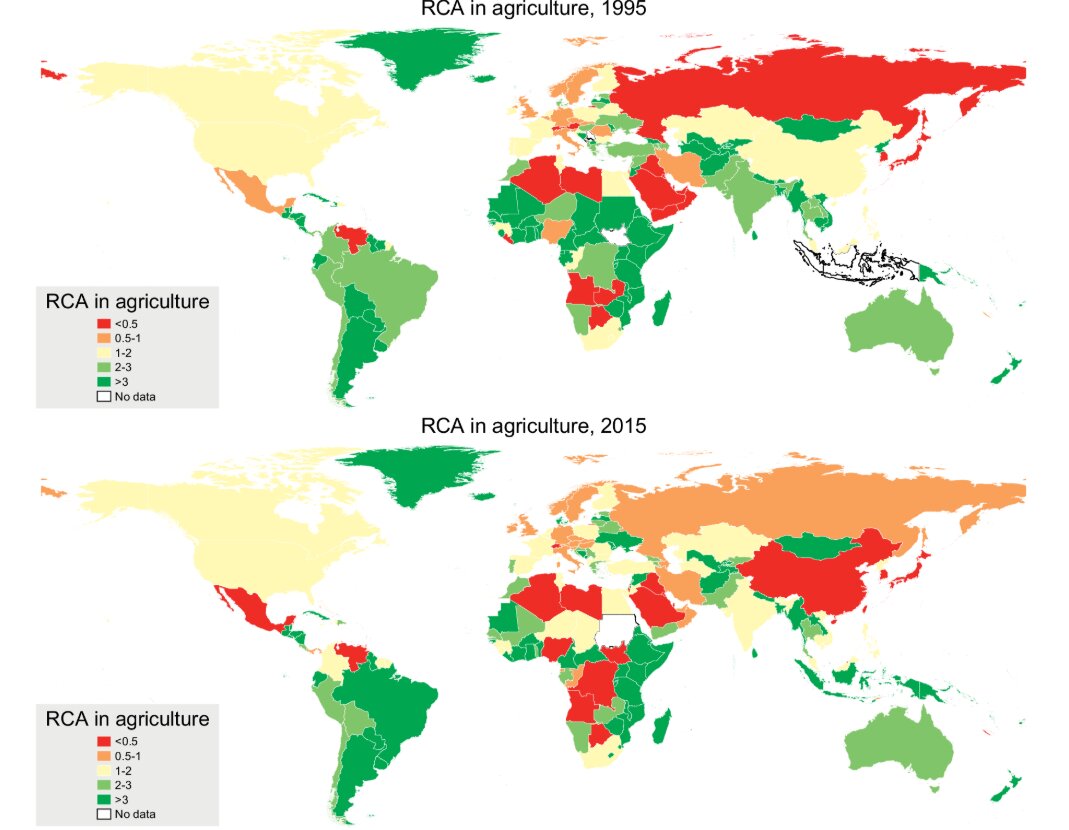
Whether country people turn against trade depends on whether their own region's farming can compete: a study of 384,194 survey answers in 123 countries, European elections and the US after NAFTA.
Tags: crop yields, food security, climate projections, agriculture, SSP scenarios, GAEZ