data source · draft
NOAA GML Trends in CO2
NOAA Global Monitoring Laboratory's record of atmospheric carbon dioxide at Mauna Loa Observatory since 1974, as daily, weekly, monthly and annual means, with a global mean series.
What is reusable: unknown sourceopen dataAPI unknownunknown participation freely available under the NOAA GML data use policy (cite the source)
The record comes as flat files, each with its own header on use and contact.2 The weekly series starts in May 1974.1,2 Monthly and annual means, daily values and the globally averaged series come as separate files.3,4 The data are free.2 NOAA (the US National Oceanic and Atmospheric Administration) asks that publications cite the data providers, in the form the trends page gives.2,3
Two notes in the weekly file matter to a model. Values for the last several months are preliminary and still under quality control.2 Measurements at Mauna Loa were suspended from 29 November 2022, after the volcano erupted, until July 2023.1,2 Observations from December 2022 to 4 July 2023 come from a site at the Maunakea Observatories, about 21 miles north.1,2
The Vitals page here reads the weekly file.
- coverage
- Mauna Loa Observatory, Hawaii; also globally averaged marine surface series
- cadence
- weekly means from May 1974; the last several months are preliminary
- access
- open download, no key
- format
- CSV, text
- homepage
- https://gml.noaa.gov/ccgg/trends/
- cost
- free; NOAA GML makes the data freely available and asks to be cited
cited by
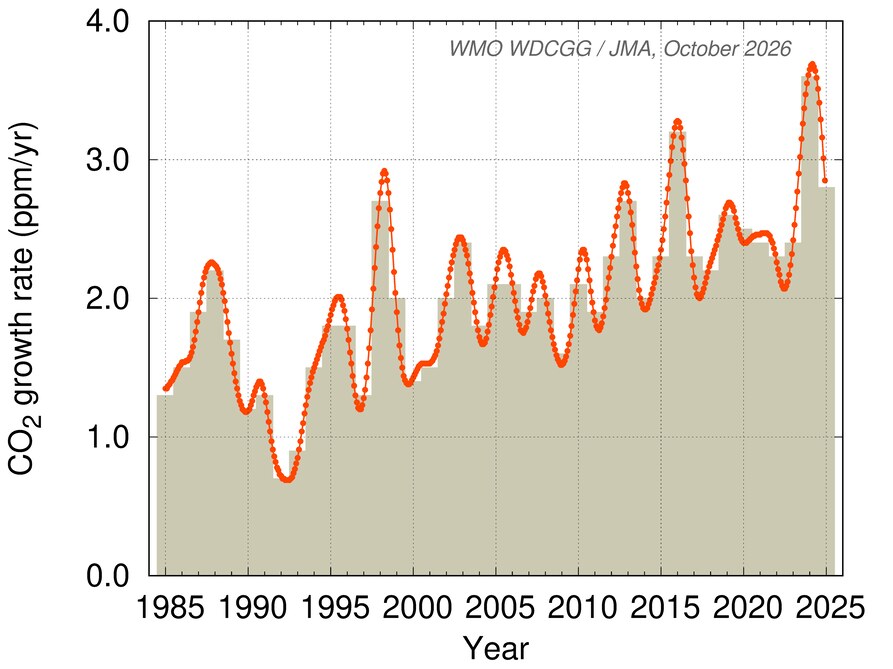
The World Meteorological Organization's report on greenhouse gases in the air in 2025, when carbon dioxide averaged 426.8 ppm and methane and nitrous oxide also reached new highs.
alternative to
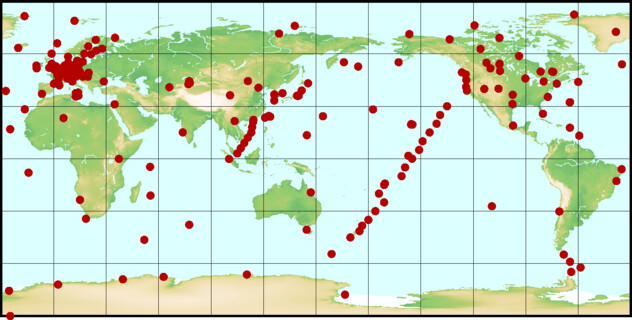
The Japan Meteorological Agency's archive, run for WMO, of greenhouse gas measurements from stations, ships and aircraft worldwide, and the source of the global means in WMO's yearly Bulletin.
open datapartly open participation
needed by
-
Running measurements of the planet's state, refreshed from their sources at every deploy.
Tags: carbon dioxide, greenhouse gases, Mauna Loa, time series